FAQ - How do I see errors in XHR requests
How do I see errors in XHR requests?
Many pages show their contents in a dynamic table that allows you to search, sort, view data one page at a time. For example, the admin pages for users, media, changes, logs, etc.
If there is an error while generating the data for these pages, you may see an error message “Invalid JSON response” (or similar).
There is generally a helpful error message hidden in the response, and you can follow these steps to find it.
(1) Enable the “Developer Toolbar” in your browser
Firefox and Chrome, press CTRL-SHIFT-I (windows / linux) or CMD-ALT-I (Mac)
Internet Explorer and Edge, press F12.
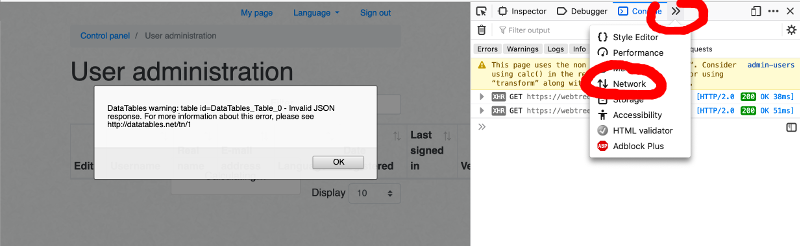
(2) Select the “Network” tab
There are lots of tabs, and it might be hidden behind a “more tabs” link
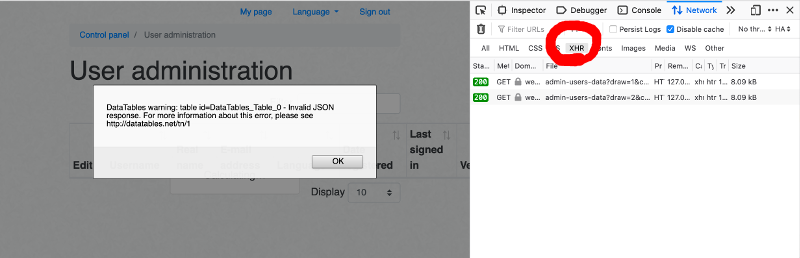
(3) Select the XHR filter and disable the others
Click on the filter tags to toggle them on and off.
(4) Reload the page
Reload the page to trigger the error.
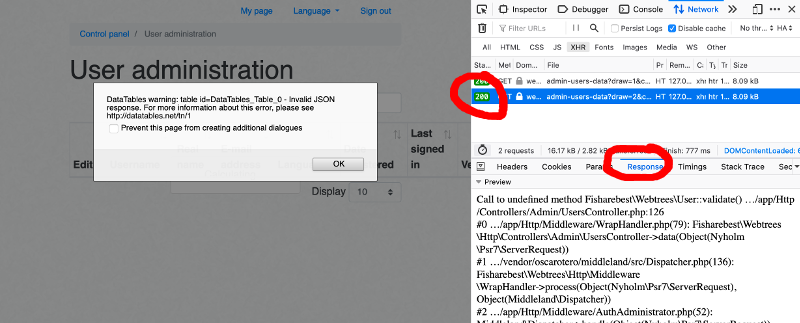
(5) Select the response
One or more XHR responses should appear. The error is probably in the last one.
Select it, and then select the “Response” tab below. The error message should then be shown.